A Dow Range Is Built From Thirty Price-Weighted Closes, Not A Cap-Weighted Average
When you see the nine setups built around how DIA actually ranges on a multi-day and multi-week basis, you will stop reading its daily chart as a slower, smaller version of a cap-weighted index, since thirty price-weighted, cyclical-tilted, dividend-heavy names range on their own terms.
You will know which weekly breaks are worth holding through industrial and financial-sector data the Dow's own cyclical tilt makes more relevant to it than to a growth-heavy index, which range extremes a rising 10-year yield is actually confirming instead of contradicting, and why DIA's own structurally tighter historical range calls for a fade zone a wider-ranging index would never use.
Most swing-trade losses in DIA come from applying a growth-index range read to a basket whose yield sensitivity, sector tilt, and realized volatility all sit on the opposite end of the spectrum.
You will get a cyclical-sector weekly breakout, a pre-bank-earnings compression triangle paired with its own earnings-week extension, a 10-year yield divergence fade, a low-volatility monthly compression fade, a defensive-rotation golden cross, a yield-curve inversion signal fade, an industrial-production data range, and a 52-week high retest sized for the Dow's own historically calmer tape.
You will see all nine setups in full, entry to exit, before you pay for a single one of them, one dollar unlocked at a time.
A Dow daily-swing range is not a quieter version of a growth-index range.
It runs on its own yield sensitivity, its own sector tilt, and its own calmer tape.
Introducing The DIA Daily-Swing Range Setups Pack
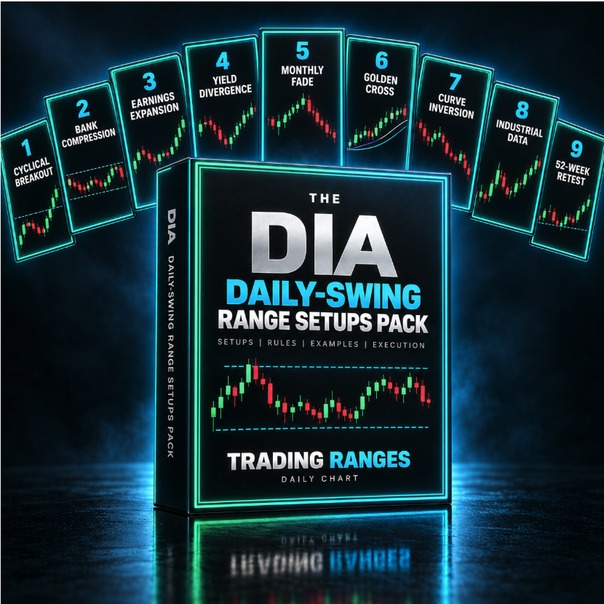
A Trading Ranges Setup Pack
The DIA Daily-Swing Range Setups Pack
Nine ways to trade DIA's multi-day and multi-week ranges on the daily chart, built around the Dow's cyclical-sector tilt, its bond-proxy dividend exposure, and its structurally tighter historical range, none of which a cap-weighted index shares.
- Setups9, each priced individually at $1
- FormatInteractive preview on this page, plus a printable PDF cheat sheet after checkout
- AccessInstant, right after checkout, yours to keep
- Built forDIA specifically, daily chart, positions held across multiple days to weeks instead of a single session
- AuthorTradingRanges.com
$1 per setup, 9 setups, $9 total. Every setup is priced and shown to you before you pay for any of it.
Try It First
Preview Every Setup In This Pack
Click through all 9 setups below. Each card is the entry trigger, the confirmation, and the invalidation point, the same detail you get after checkout. The bar fills as you go, one dollar unlocked per setup.
What's Inside
All 9 Setups
- 01Cyclical-Sector Weekly Range Breakout Confirmation. Trade a DIA weekly breakout only when it coincides with strong industrial or manufacturing data, since the Dow's cyclical-sector tilt makes that data more directly relevant to it than to a growth-heavy index.Daily chart, held multiple days, on a strong industrial or financial-sector data print
- 02Pre-Bank-Earnings Compression Triangle. Trade DIA's own pre-earnings compression into the week the major bank components report, since the Dow's meaningful financial-sector weight makes that specific earnings window a genuine multi-day catalyst it carries and a growth-tilted index does not.Daily chart, the days leading into the major banks' quarterly earnings, held through the reports
- 03Bank-Earnings-Week Range Expansion. Trade the range expansion that follows a genuine bank-earnings surprise on credit conditions, a Dow-specific catalyst tied directly to its meaningful financial-sector weight.Daily chart, the week the major bank components report
- 0410-Year Yield Divergence Fade. Fade a DIA range high that a rising 10-year yield is not confirming, since the Dow's dividend-heavy, bond-proxy tilt should make it more sensitive to rising yields than a growth-tilted index, not less.Daily chart, measured against the 10-year Treasury yield over a week or more
- 05Low-Volatility Compression Monthly Range Fade. Fade a twice-tested DIA monthly range extreme using a tighter target zone than a comparable mega-cap or small-cap index setup, since DIA's own realized volatility has run structurally lower given its defensive, dividend-heavy, cyclical tilt.Daily chart, at a monthly range extreme, sized for DIA's own tighter historical range
- 06Golden-Cross Defensive Rotation Range. Only trust a golden cross in DIA once it lines up with a genuine rotation of capital into defensive, dividend-paying sectors, since a Dow-specific cross without that rotation behind it can simply reflect a broad market-wide rally lifting every index together.Daily chart, using the 50-day/200-day moving-average cross plus sector-rotation flow
- 07Yield-Curve Inversion Signal Fade. Buy a DIA range-low test driven by yield-curve inversion headlines when the Dow's own cyclical, industrial-heavy data are not actually confirming a genuine recession signal, a Dow-specific read since its cyclical tilt makes that industrial data the more relevant confirmation check than it would be for a growth-heavy index.Daily chart, buying a range-low test the yield curve is not actually confirming
- 08Industrial-Production Data Reaction Range. Trade a DIA weekly range breakdown on weak industrial-production or manufacturing data as a Dow-specific catalyst, since the Dow's cyclical, industrial-heavy tilt makes that data more directly relevant to it than to a growth-tilted or small-cap index with a different sector mix entirely.Daily chart, on a weak industrial-production or ISM Manufacturing print
- 0952-Week High Low-Volatility Retest Swing. Buy a held retest of a former DIA 52-week high with a tighter confirmation buffer than the same setup would use in a higher-volatility index, since a genuine failed retest has historically been rarer in DIA's own calmer, defensive-tilted tape.Daily chart, after a new 52-week high, sized for DIA's own calmer historical tape
RANGES
★
Certificate of Guarantee
60-Day, No-Questions-Asked
If The DIA Daily-Swing Range Setups Pack doesn't earn its place in your process, email us any time within 60 days of purchase for a full refund. No form to fill out. No reason required.

Backed personally by Jason Parker, founder of Trading Ranges. He built every setup in this pack himself, covered by the same guarantee above.
Instant Access
$9One-time payment. No subscription.
9 setups × $1 each = $9
Get Instant Access9 SETUPS · INTERACTIVE PREVIEW + PDF CHEAT SHEET · DELIVERED IMMEDIATELY AFTER CHECKOUT · 60-DAY GUARANTEE
A Few Notes On Trading DIA's Daily-Swing Ranges
Every other DIA pack in this shop is built for an intraday chart, five minutes up to a single hour, where a range forms and resolves within one to a handful of sessions, and where the Dow's price-weighting mechanic itself is the featured setup. This pack is built for the daily chart instead, where a range takes weeks or a full quarter to form and the Dow's own sector tilt, yield sensitivity, and structurally lower volatility become the tradable signals rather than the price-weighting mechanic those faster packs already cover. That is also why this pack does not use a VWAP setup anywhere in it. VWAP resets every session and carries no meaning across a multi-week hold.
The habit that separates a trader who swings DIA's daily ranges well from one who gets chopped up by them: recognizing that the Dow's thirty components skew cyclical (industrials, financials, healthcare) and dividend-heavy relative to a growth-tilted index, which means DIA's own multi-week range reacts more directly to industrial data and Treasury-yield moves than a growth-heavy index does, and reacts less to the kind of single-headline growth-stock news that can swing a tech-heavy index on its own.
None of this is built for a same-day scalp. Every setup below assumes overnight and multi-day exposure, gaps included, and a fade zone sized for DIA's own structurally lower historical volatility relative to the other index ETFs in this shop.
Common Questions
Why is this priced at $1 per setup?
Every setup in The DIA Daily-Swing Range Setups Pack is priced individually and added up. This pack has 9 setups, so it is $9 total, no more and no less. The interactive preview above shows every setup before you pay, so nothing is padded in to round out a bundle.
How is this different from the other DIA packs in this shop?
The 5-Minute, 15-Minute, and Hourly DIA packs are built for intraday and multi-day intraday charts, and feature the Dow's price-weighting mechanic directly. This pack is built for the daily chart, positions held across multiple days to weeks, and leans on the Dow's cyclical-sector tilt, yield sensitivity, and structurally lower volatility instead, signals that only mean something once you stop measuring in minutes.
What timeframe is this pack for?
Every setup in this pack is built for the daily chart, with positions typically held for several days up to a few weeks depending on the setup.
What do I actually get after I pay?
Instant access to a printable PDF cheat sheet with the entry trigger, confirmation, and invalidation point for all 9 setups in this pack, the same detail shown in the preview deck above, formatted for a second screen or the desk next to your monitor.
Is there a guarantee?
Yes. The same 60-day, no-questions-asked guarantee as everything else in the shop. Email any time within 60 days of purchase for a full refund.